If you work with the online version https://www.draw.io/ (coupled with google drive for example) or with the desktop draw.io application you can download your work as *.drawio file.
This is an XML file, but for performance reasons (in online scenarios) the content of the graph is compressed.
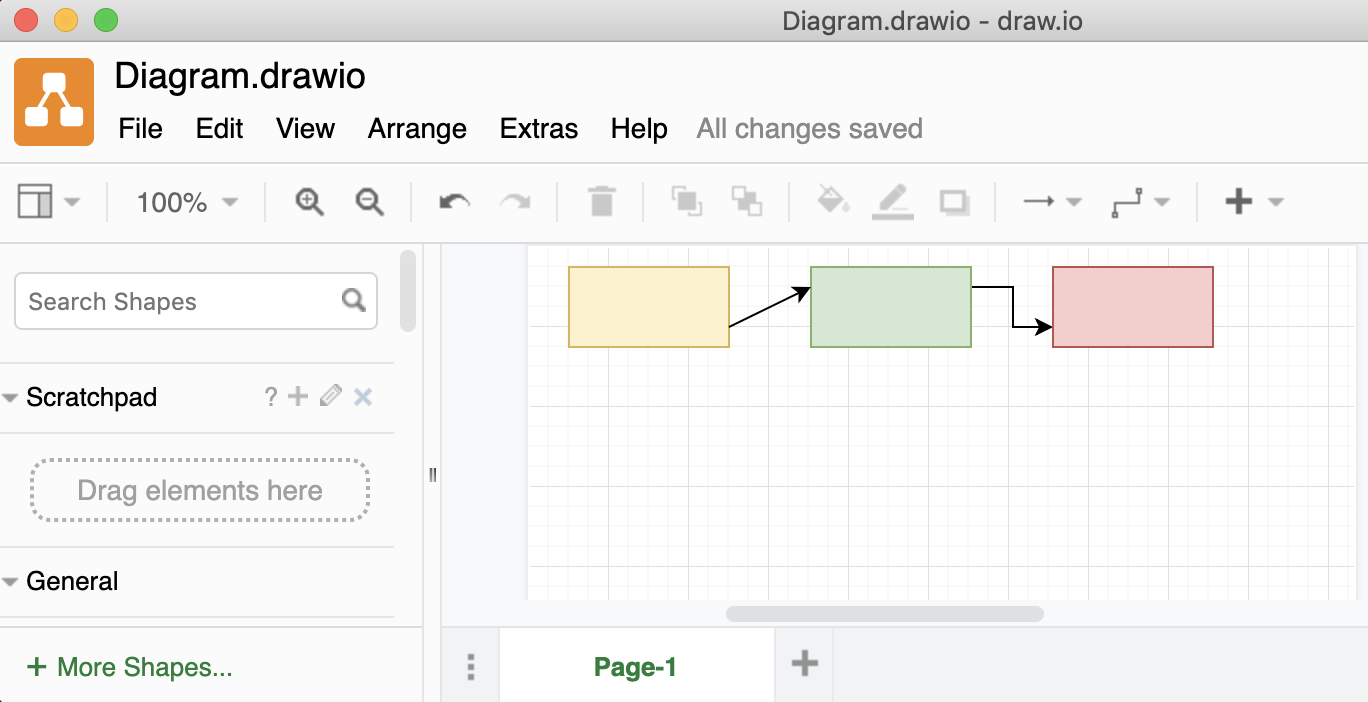
Assuming you have only one tab “Page-1”, your *.drawio file looks like this:
<mxfile modified="2019-08-01T09:23:36.597Z" host="" agent=".." etag="M34yXdgxU2q9AoIo9Xkg" version="10.9.5" type="device">
    <diagram id="sgW9pF4t5AKx6TWdV9Rh" name="Page-1"><!-- diagram content here --></diagram>
</mxfile>
Example of a compressed file:
<mxfile modified="2022-04-25T22:16:45.897Z" host="" agent=".." etag="M34yXdgxU2q9AoIo9Xkg" version="17.4.2" type="device">
    <diagram id="PLuXOcR_mGlr0jXjKg2p" name="Page-1">zVbfb5swEP5reOwUMBD2uKZZW2mbKmXSur05+ALeDI6MSaB//Uw4As7vVm3VJ3yf787cd99hHDLJqltFl+l3yUA43ohVDrlxPM91R6F5NEjdIuOx3wKJ4gydemDGnwDBEaIlZ1BYjlpKofnSBmOZ5xBrC6NKybXttpDCPnVJE9gDZjEV++gvznTaor5LevwOeJLiyUGEGxntfLGQIqVMrgcQmTpkoqTU7SqrJiAa7jpa2rivR3a376Ug15cE3CcZfbhj85/3f8gqKK9+hJ+frjDLiooS68WX1XVHgJJlzqBJMnLI9TrlGmZLGje7a9Nyg6U6E8ZyzXLBhZhIIdUmliwWCy+ODV5oJf/BYIeF8zAIzc5+Gd07gdJQDSAs6xZkBlrVxgV3O4ZrWznrvl0RQumgUz5iFAWSbPP2JJoF8vgMTvcpBGYkhaZUOpWJzKmY9ui1TXLv803KJVL7F7SucT5oqaVNPFRcPw7Wv5tUn7wAzZsKU2+MujNyU+/j0GjDxkFn93Ebqws82rRCliqGE+TgdGiqEtAn/ILWr2HupAQUCKr5yh7WV28pedsxYQFEzD80JpE3J+ErjYnrux9qTvzzpELOvjTfcGPFghYFj3dUf0TA3jkBHx6X8elxebnqu4vrnOrJhaoftCw40LIOu3g48IQHyU1l/Xd1Ry9uZGdoy8ag4c2zk2ds5wl30rSs7KXZaGpb88tlFrzxFRfFcPiKm0eBH5zUzTOuuNB7p9k1Zv9P0vag/7Ej0/8=</diagram></mxfile>
</mxfile>
Motivation
If you would like to store your draw.io sources inside a git repository, storing the graphs as uncompressed and formatted XML is way better to understand the changes between the revisions.
It is always possible to open a *.drawio file containing compressed or uncompressed xml content.
Conversion tool
The content inside the <diagram>..</diagram> can be uncompressed with following steps:
- Base64 decode
- Inflate
- URL decode
Example script to do those operations in Java: decodeDiagram.java
jgraph provides a conversion tool that does the 3 steps inside a webpage.
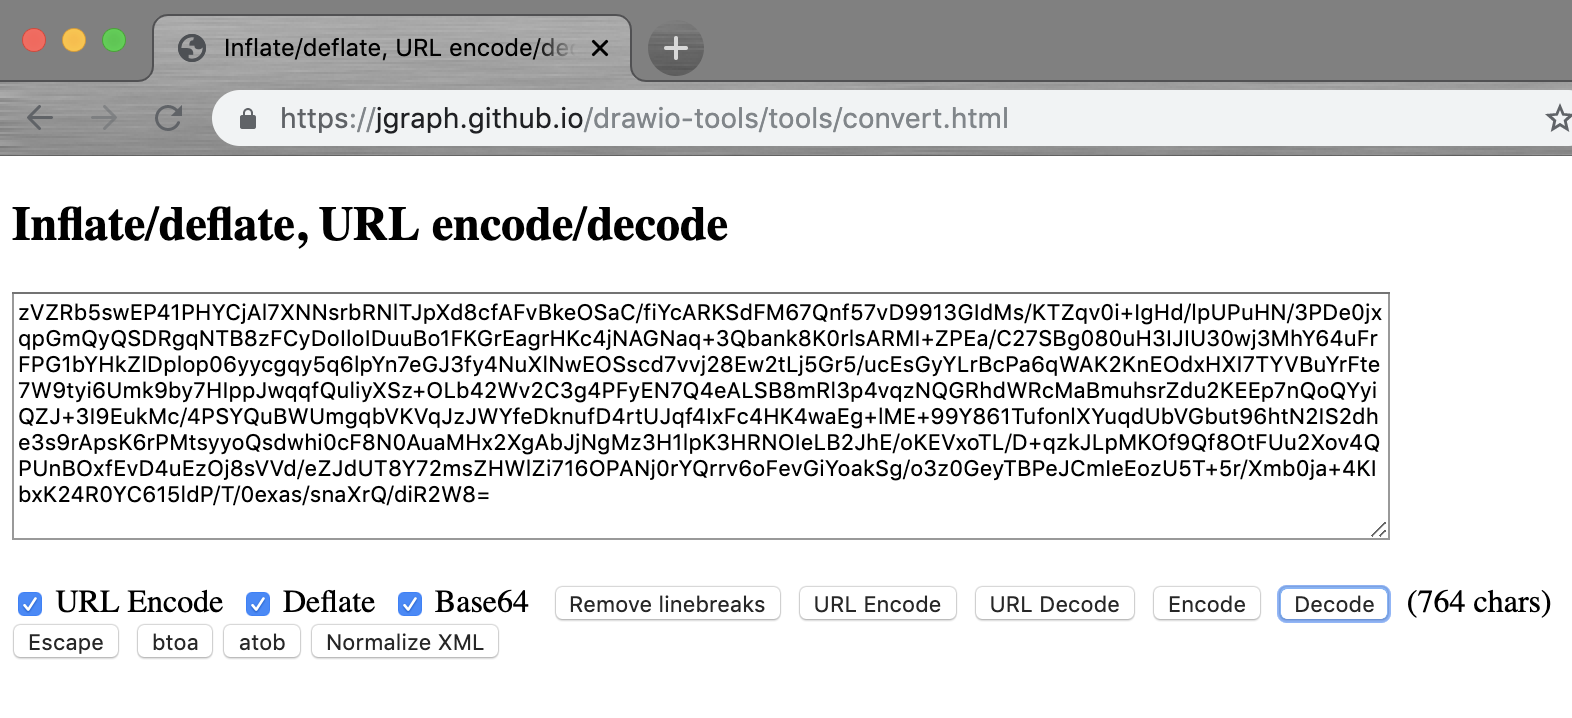
Paste your content, and hit decode.
You get something like this:
<mxGraphModel dx="1106" dy="776" grid="1" gridSize="10" guides="1" tooltips="1" connect="1" arrows="1" fold="1" page="1" pageScale="1" pageWidth="413" pageHeight="583" math="0" shadow="0">
  <root>
    <mxCell id="0" />
    <mxCell id="1" parent="0" />
    <mxCell id="IgmaPHdbTIZ3v5u-N69z-1" value="" style="rounded=0;whiteSpace=wrap;html=1;fillColor=#fff2cc;strokeColor=#d6b656;" vertex="1" parent="1">
      <mxGeometry x="20" y="10" width="80" height="40" as="geometry" />
    </mxCell>
    <mxCell id="IgmaPHdbTIZ3v5u-N69z-2" style="edgeStyle=orthogonalEdgeStyle;rounded=0;orthogonalLoop=1;jettySize=auto;html=1;exitX=1;exitY=0.25;exitDx=0;exitDy=0;entryX=0;entryY=0.75;entryDx=0;entryDy=0;" edge="1" parent="1" source="IgmaPHdbTIZ3v5u-N69z-3" target="IgmaPHdbTIZ3v5u-N69z-5">
      <mxGeometry relative="1" as="geometry" />
    </mxCell>
    <mxCell id="IgmaPHdbTIZ3v5u-N69z-3" value="" style="rounded=0;whiteSpace=wrap;html=1;fillColor=#d5e8d4;strokeColor=#82b366;" vertex="1" parent="1">
      <mxGeometry x="141" y="10" width="80" height="40" as="geometry" />
    </mxCell>
    <mxCell id="IgmaPHdbTIZ3v5u-N69z-4" value="" style="endArrow=classic;html=1;entryX=0;entryY=0.25;entryDx=0;entryDy=0;exitX=1;exitY=0.75;exitDx=0;exitDy=0;" edge="1" parent="1" source="IgmaPHdbTIZ3v5u-N69z-1" target="IgmaPHdbTIZ3v5u-N69z-3">
      <mxGeometry width="50" height="50" relative="1" as="geometry">
        <mxPoint x="21" y="118" as="sourcePoint" />
        <mxPoint x="71" y="68" as="targetPoint" />
      </mxGeometry>
    </mxCell>
    <mxCell id="IgmaPHdbTIZ3v5u-N69z-5" value="" style="rounded=0;whiteSpace=wrap;html=1;fillColor=#f8cecc;strokeColor=#b85450;" vertex="1" parent="1">
      <mxGeometry x="262" y="10" width="80" height="40" as="geometry" />
    </mxCell>
  </root>
</mxGraphModel>
Attribute “compressed”
Defining the format inside each file is possible as well.
You just need to set the compressed attribute to true or false inside the mxfile root tag:
Set compressed xml format in the file:
<mxfile compressed="true" host="Electron" modified="2020-08-13T04:03:47.601Z" agent=".." etag="kCKDMwt64oLDwPazfI5o" version="13.6.2" type="device">
  <diagram id="rx-sphuGNtGZ9p413biy" name="Page-1"><!-- compressed diagram content here --></diagram>
</mxfile>
Set uncompressed xml format in the file:
<mxfile compressed="false" host="Electron" modified="2020-08-13T04:03:47.601Z" agent=".."  etag="kCKDMwt64oLDwPazfI5o" version="13.6.2" type="device">
  <diagram id="rx-sphuGNtGZ9p413biy" name="Page-1">
    <!-- uncompressed diagram content here: <mxGraphModel>..</mxGraphModel> -->
  </diagram>
</mxfile>
When the attribute is set, the compression is preserved on the next save.
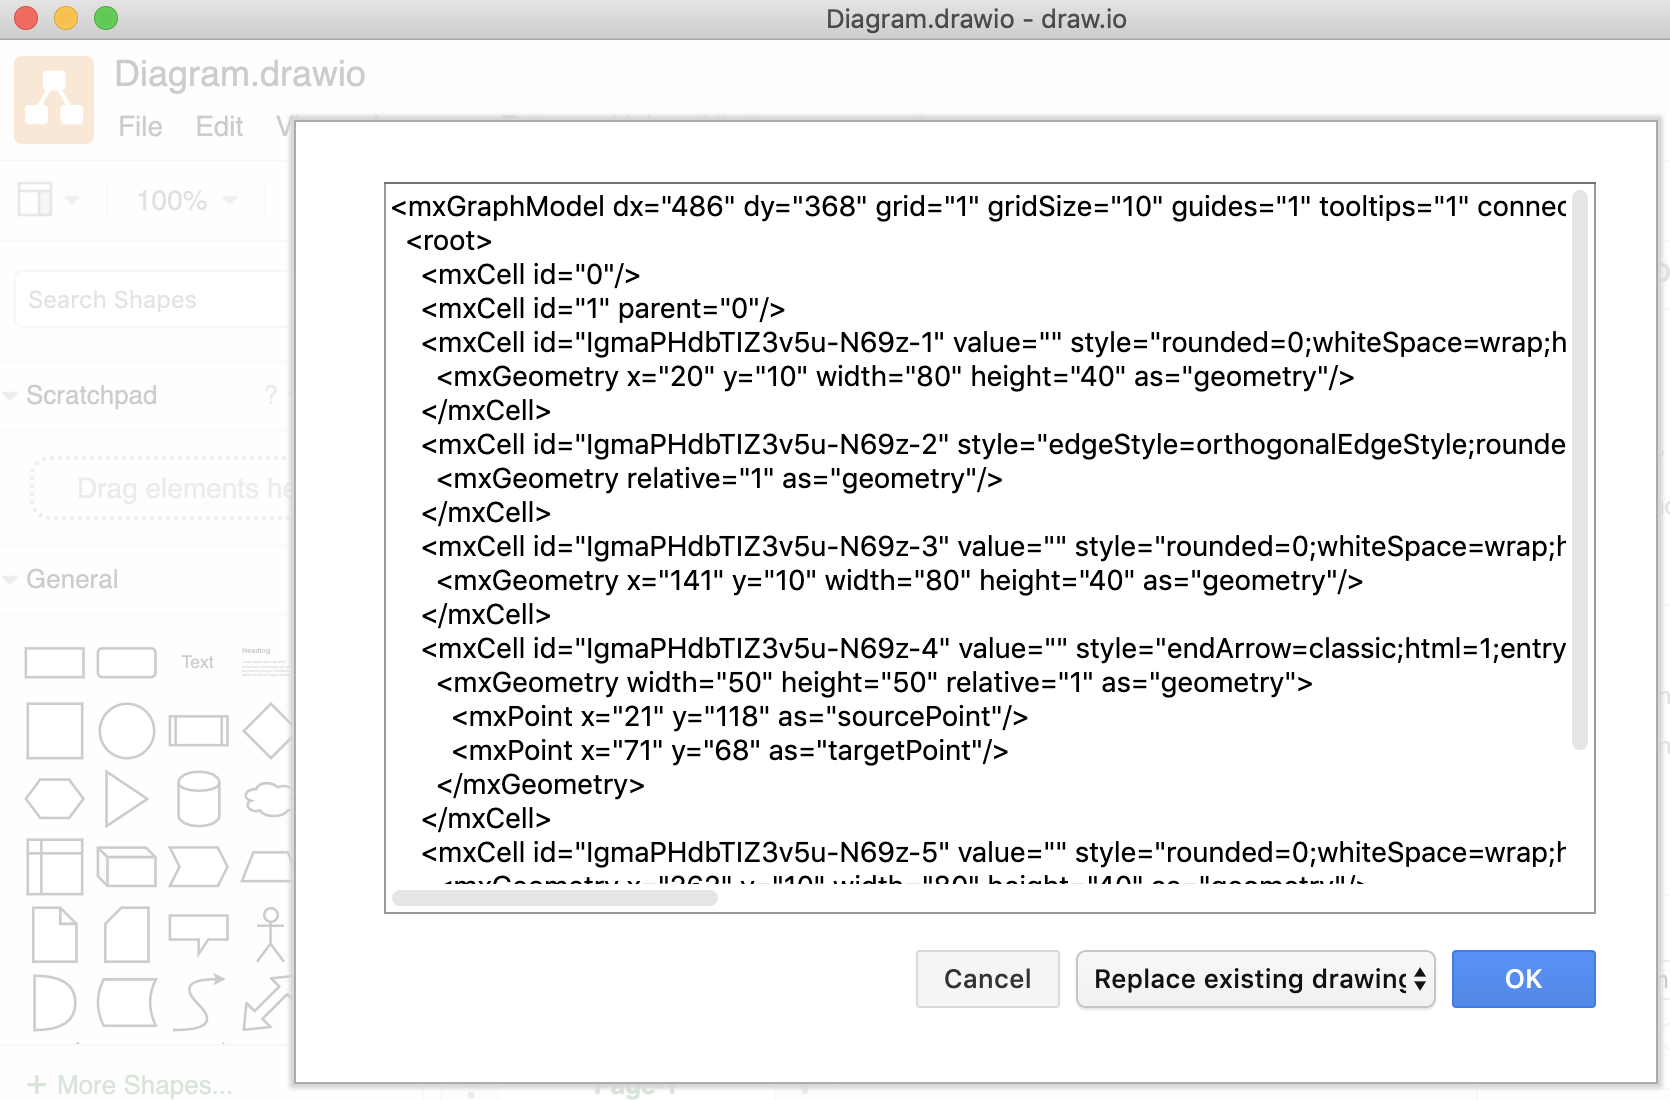
Display the diagram from the application
Under “Menu > Extras > Edit Diagram…” inside the draw.io application you can access the decoded xml content.
See also
References: